


Aside from a credit union’s membership, loan interest income has to be a top-tier area of focus for a credit union in terms of survivability. In fact, examining the number of new loan applications a credit union receives can even potentially be used as a predictor of the success or failure of a credit union. But how?
Analyze the data
First, I should disclose I’m not a credit union expert. However, I do have these two general beliefs:
- The lion’s share of a credit union’s revenue comes from loan interest
- It is more difficult for a credit union to create loans without loan applications
So let’s dive into the data a bit and break down the number of loan applications a credit union received over the last 365 days.
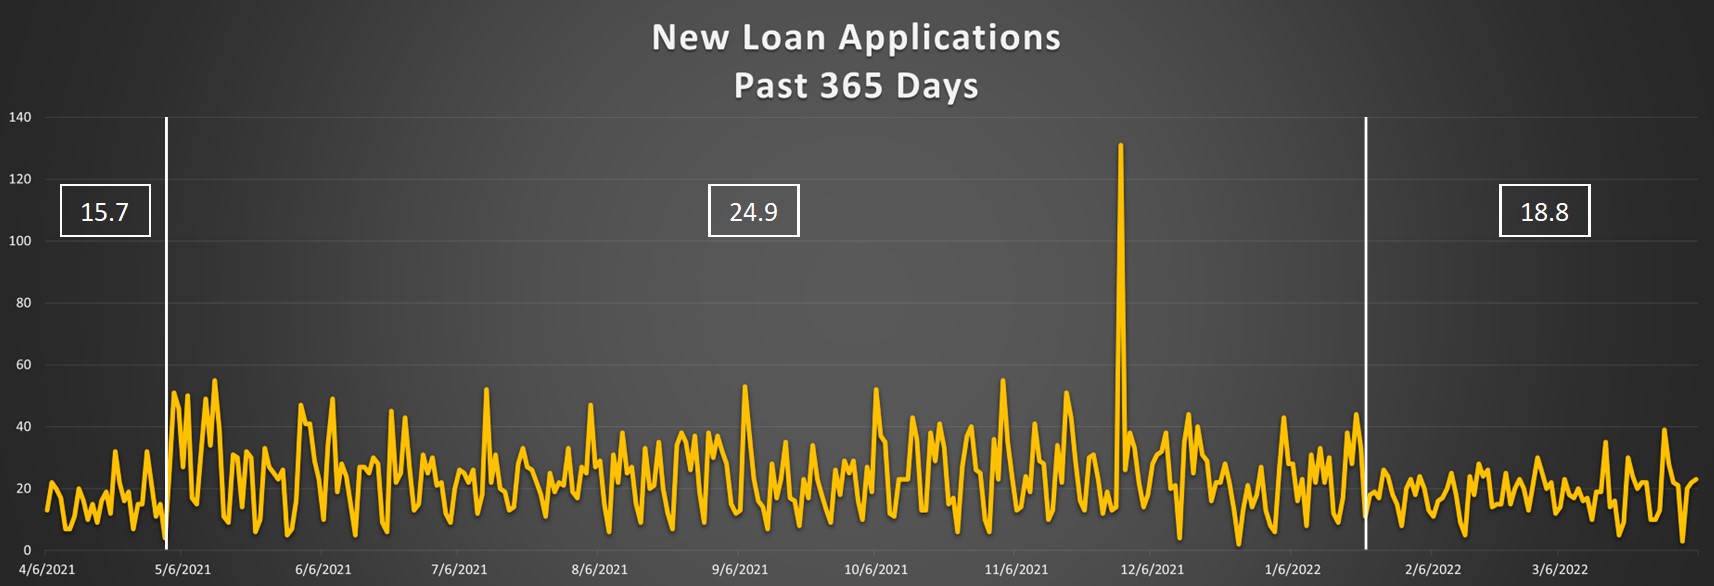
First, the boxes in each section are the average loan applications a day for that timeframe. At a fairly quick glance, you can see there are four major events that took place over the past year.
First, the elephant on the graph happening around the beginning of December shows a huge spike in applications. On that day, the credit union received over 130 applications as compared to their daily average of 23 for the entire year. That’s nearly a 600% lift in one day. A very impressive and eye-catching event.
Next, there appear to be three more subtle trends going on here. The first is at the beginning of the chart that ran for about a month. Then there was a consistent lift in the number of applications per day for about eight months, and finally, the last three months of the period show a dip in the number of applications per day.
Interpreting the data
So what conclusions can be drawn from this information?
First, the nearly 600% spike in applications in one day was probably due to a special one-time event. The key here is that while the event may have been a great way to bring in more applications, it had no staying power after that day. In other words, it did not influence the average loan applications leading up to that event nor immediately following.
Secondly, if you focus on the first month of the graph in April you will see there was a significant lift (over 9 per day) in the number of loan applications that started coming into the credit union around early May. In my opinion, it is the most significant move on this graph because it represented nearly eight months of staying power and over 2,000 new applications. The 130 single-day spike clearly pales in comparison. We’ll examine the importance of this lift in the average a bit later.
Lastly, on the far-right section of the chart around late January, you will notice another shift (in this case a drop) in loan application activity for about a three-month run. As far as the causes of the shift in application activity, we can’t be entirely sure, but one could speculate seasonality or a merger might play a factor in this activity over the year.
How loans determine survivability
Leaving the cause discussion alone, I want to focus on what these shifts in new application activity might mean to the credit union and its survivability. As I stated earlier, loan applications play a major role in terms of success for most credit unions. Looking at the table below we can start to get a sense of what future income might be for these applications.
I broke down the three distinct patterns of new loan applications over the year and did some forecasting. For the purposes of this example, let’s say the average applications for each group were consistent for an entire year.
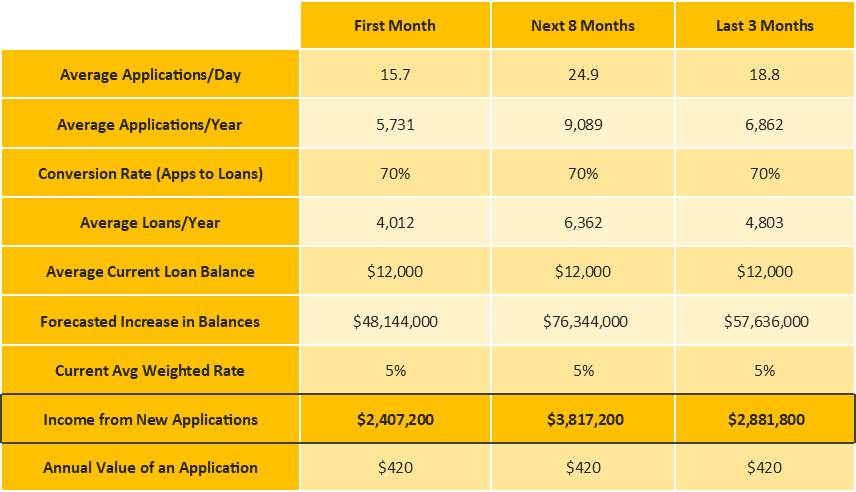
As you can see from the income line, there are very material changes in the credit union’s income stream depending on the average loan applications in the pipeline. The jump from 15.7 to 24.9 applications per day resulted in a $1.4 million increase in income for the year.
Another way to look at this is by putting an income value on each new loan application. In this case, increasing the average applications by one per day is $420 per application, and annualized that’s over $150,000 in income.
The takeaway
As a collateral benefit of this exercise, the credit union may be better positioned to budget loan interest income in the future. Do you know the value of a new loan application at your credit union? It may be worth finding out in order to help you predict your revenue stream going forward.
So next time someone says they increased their average loan applications per day by two, you can start to imagine how this credit union might put to use the additional $300,000 of income. This approach creates connective tissue between application numbers and revenue dollars. Knowing the value of a loan application can put some real meaning behind your marketing efforts on how to increase applications coming into the credit union.