


Editor’s note: This article was first published in July 2021. In light of the NCUA’s decision to drop the NOL to 1.33%, we wanted to share Chip’s insights on the NCUSIF and the “historically proven” 1.3% cap.
Read more at chipfilson.com
The NCUA’s request for comments on NCUSIF’s Net Operating Loss (NOL) assumes the core model of a .2 to .3% level of retained earnings on top of the 1% credit union underwriting is inadequate. Chairman Harper openly states this view. The facts going back to 1984, or 36 years of operation, show otherwise.
From 1984 through 2007, the NCUSIF’s financial model delivered the results promised. Losses were minimal, there were dividends in a number of years, premiums assessed only twice, and the NOL was easily maintained in the .2 to .3 range.
So successful was the model that the fund paid six consecutive dividends from 1995 to 2000 and again in 2006 and 2008. It would have distributed more except the NCUA changed the way it calculated the NOL by excluding the required yearend true-up of the 1% deposit beginning in 2001.
The following graphs are based on NCUSIF’s audited statements for the years 2008 through 2020. This 13-year span is used because it includes the two great post-Depression systemic financial crises and years of historically low-interest rates to prod recovery. Here is what the data shows.
Coverage for insured loss risk
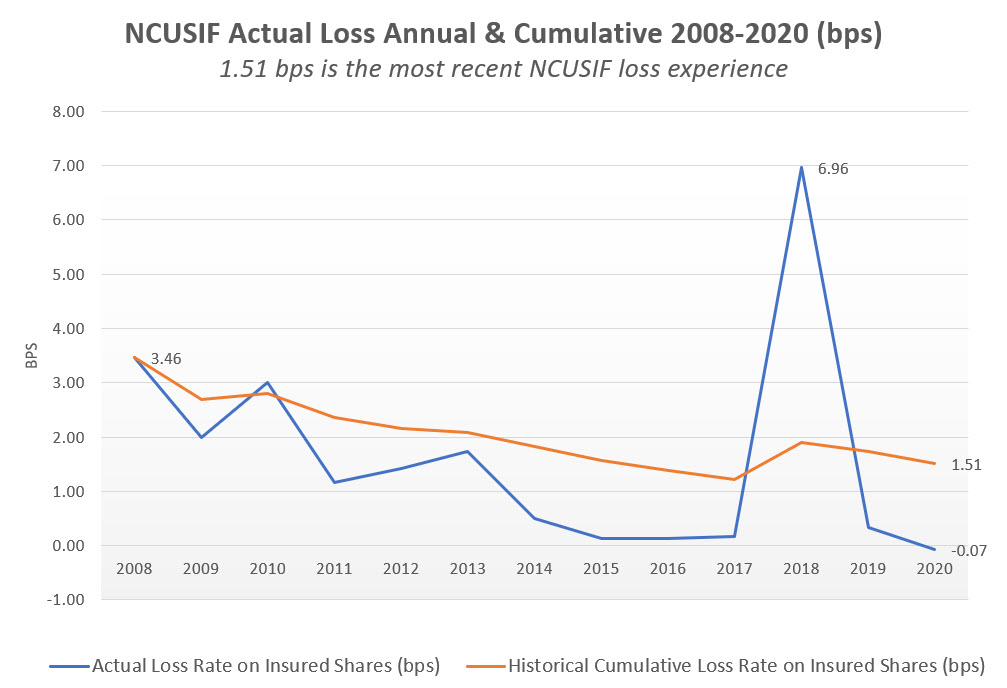
Throughout this period, the cumulative actual losses were 1.51 basis points of insured shares. In five of these years, losses were less than 1 basis point. In 2020, cash recoveries exceeded losses.
During the 2008-2010 Great Recession, actual losses never exceeded 3.5 basis points. The peak year in losses was 2018 at 7 basis points when the NCUA liquidated the taxi medallion conserved by credit unions.
The year-by-year actual loss and the cumulative long-term loss experience of 1.51 basis points are shown below. The normal NOL range of 10 basis points is almost 7 times greater than this historical average.
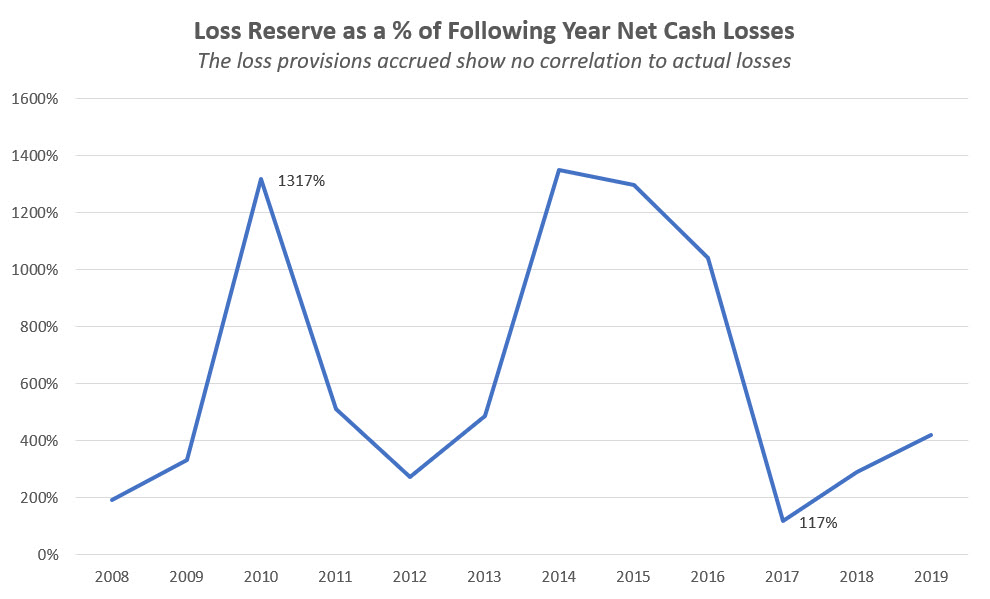
However, the NCUA’s accounting estimates for loss provision expense, on a year-in-year-out basis, have no correlation to actual events. This provision expense is shown in annual reports as “insured losses” and creates a very misleading presentation.
The graph below shows that the provision account has been at times funded at a level 10 times (1000%) greater than the following year’s actual losses. In credit unions, the allowance account ranges between 1 and 1.5 times actual losses.
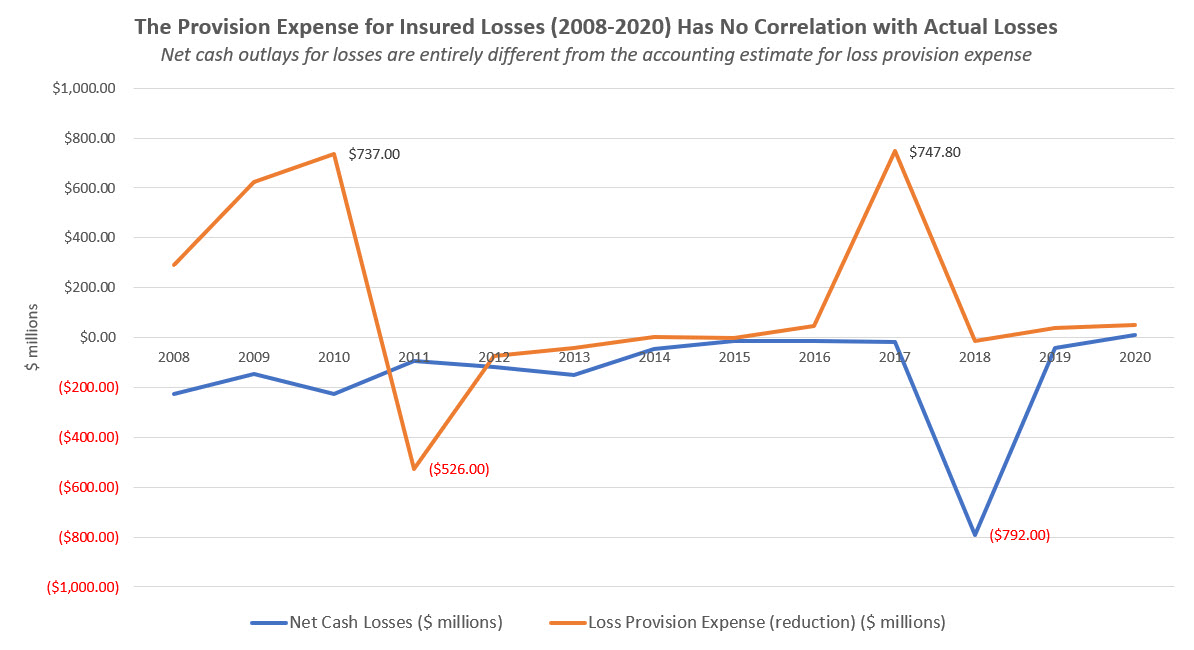
The result of this misleading loss provisioning results in dramatic swings, from an expense of $737 million in 2010 to a reversal of $526 million in 2011, a total of income statement impact of $1.3 billion in just two years.
The graph below shows how these mistaken estimates create a wide variance in reported net income versus the actual insured losses. These exaggerated loss provisions were the basis for assessing unnecessary premiums rather than informed judgments based on historical loss experience and a common-sense view of current events.
NCUSIF operating expenses exceed insurance losses
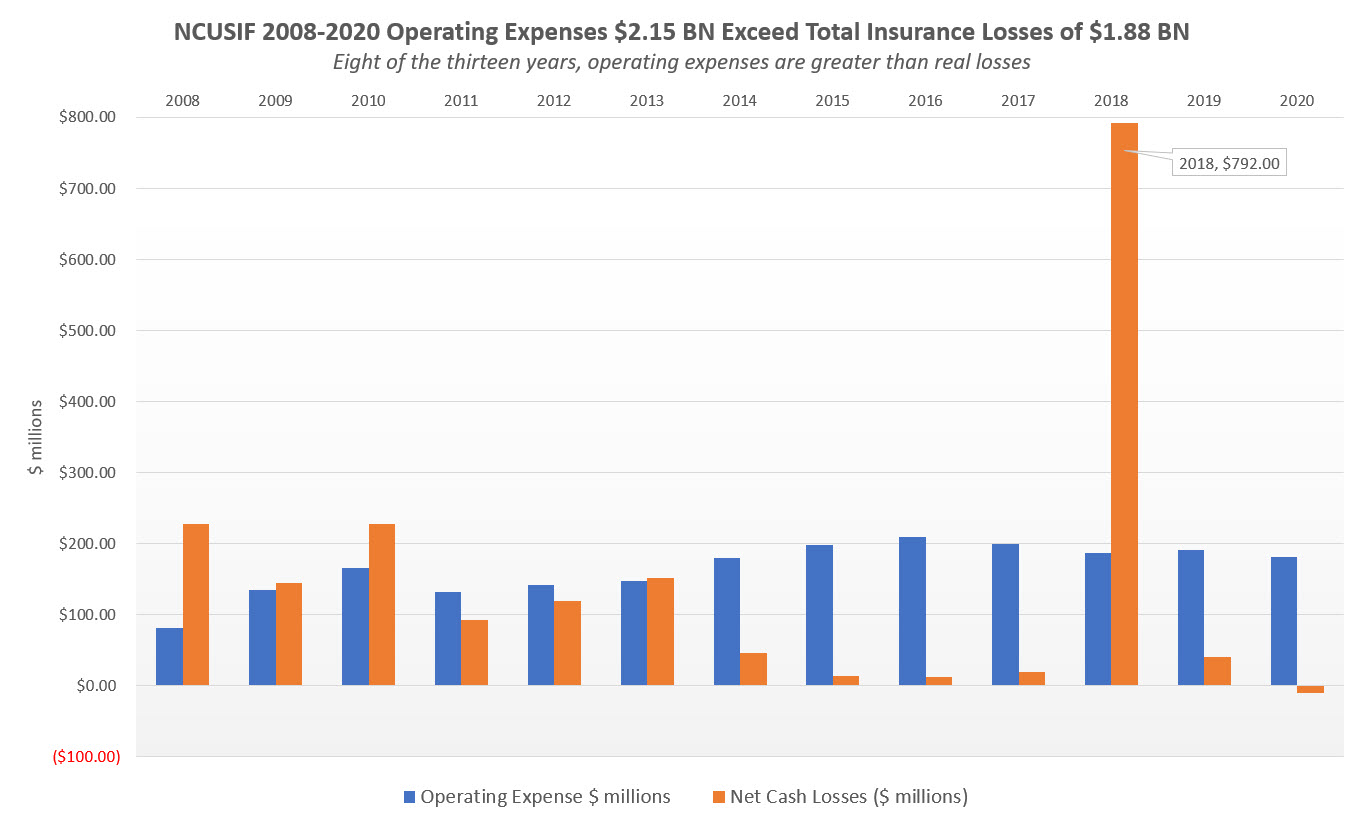
Over the past 13 years, the NCUA has charged the NCUSIF $2.2 billion in expenses, an amount of $270 million greater than all insured losses of $1.9 billion for the same period.
The result is that the NCUSIF has become the primary funder of the NCUA’s operations, rather than the operating fee intended for this purpose.
The graph below shows that in eight of the past 13 years, operating expenses have been greater than insured losses:
This outcome is because over 93% of the NCUSIF’s operating expenses are from the Overhead Transfer Rate (OTR). This transfer charge has ranged from a low of 52% (2008) to as high as 73.1% (2016) of the agency’s total yearly spending.
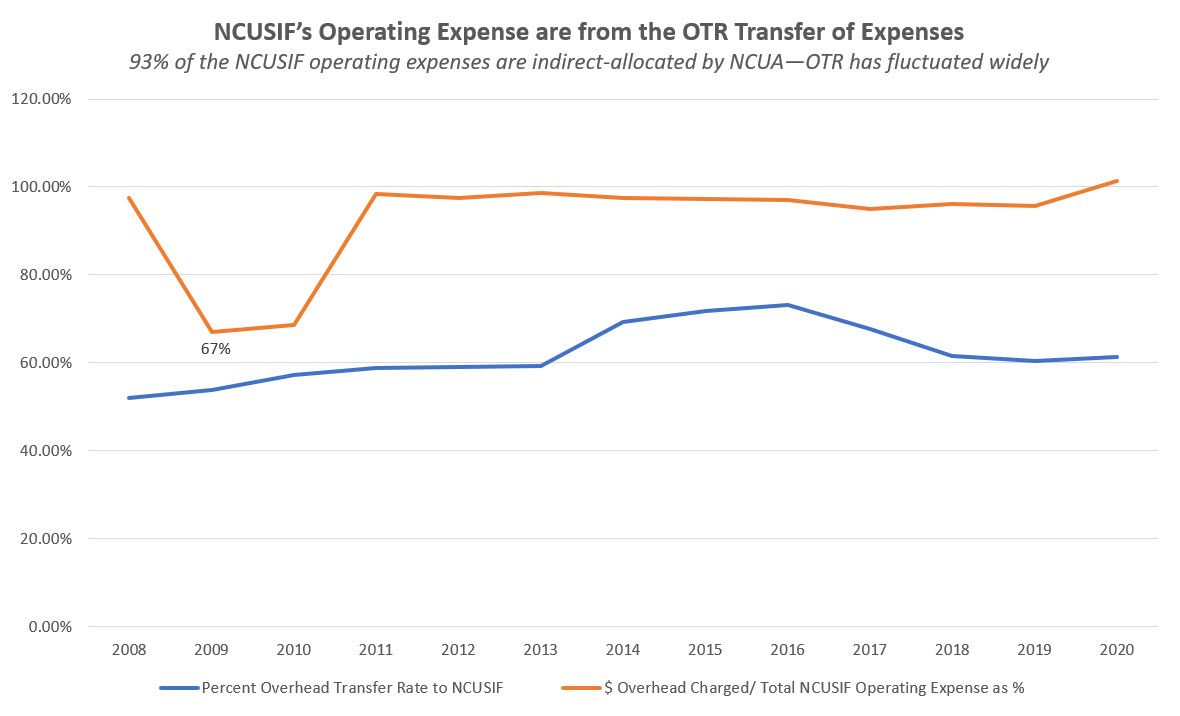
The combination of these arbitrary changes in the OTR (state-chartered federally insured credit unions have never exceeded 50% of the insured base) and wildly inaccurate loss provisions illustrate the difficulty of relying on the NCUA’s financial reports to assess the sufficiency of the NCUSIF model.
In fact, a reasonable interpretation is that the model has functioned well despite significant missteps by the NCUA.
NCUSIF’s total yearend reserves are much higher than the reported NOL
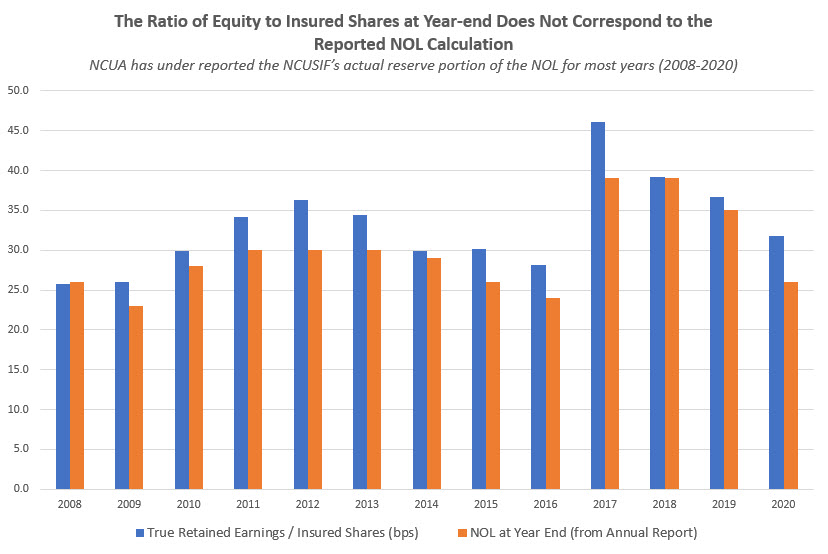
Since 2001, the NCUA has not included the yearend true-up of the 1% required credit union deposits when calculating the NOL. The result is to understate the actual NOL. It is easy to calculate the actual reserves above the 1% deposit contributions by dividing the reserves by insured shares.
When this is done as shown on the chart below, the actual NOL is always greater than the number the NCUA reported. In some years, the difference is over 5 basis points.
For example, in 2020, the NCUA reported the NOL was 1.26% whereas the actual number was 1.32%. Each basis point of 2020 insured shares is $144 million. This belated true-up practice substantially misrepresents the NCUSIF’s actual financial condition.
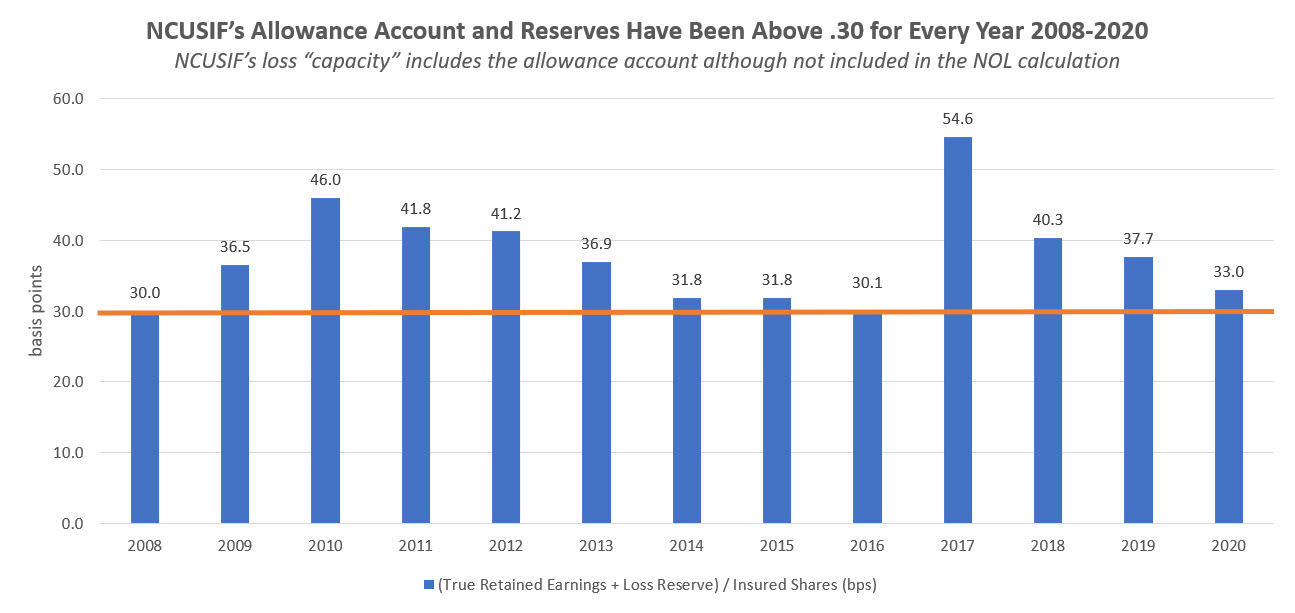
Moreover, by adding the allowance for loss (already expensed) to the retained earnings, the actual dollars and margin in bps for covering losses are greater than the just ending NOL. As shown below, the reserves plus allowance account have exceeded the .3% level (or legal cap for a premium) for the NCUSIF every year since 2008. In 2017, this total reached a peak of 55 bps or 25 bps higher than 1.3%.
Federal GAAP accounting further confuses the NCUSIF’s presentation
The NCUA board’s adoption of Federal GAAP standards for NCUSIF reporting in 2010 created two additional transparency problems.
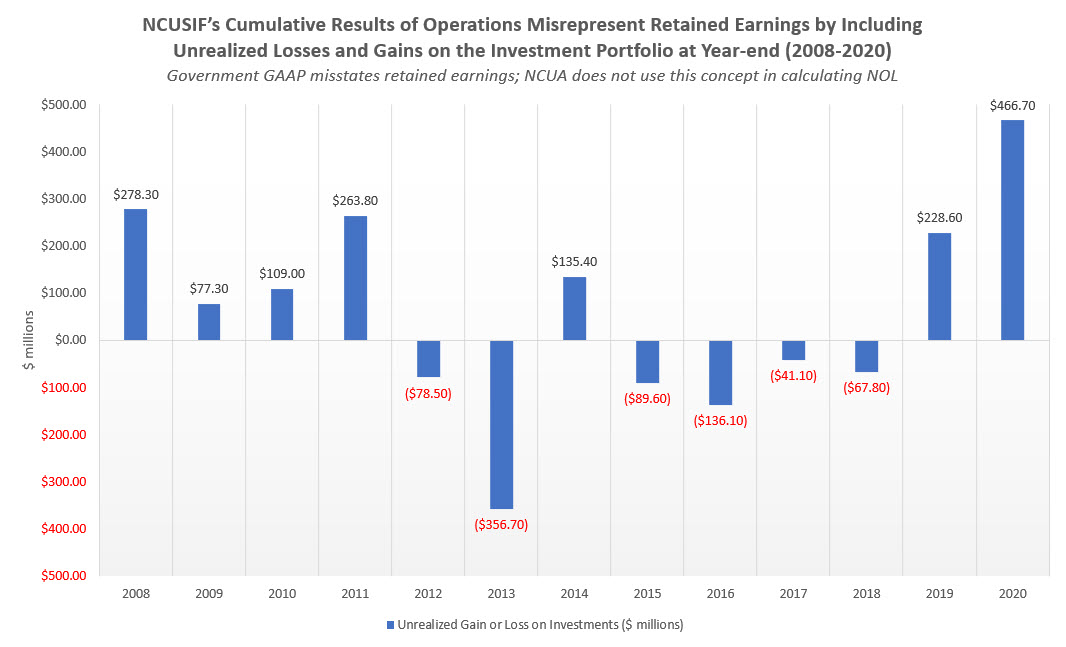
Federal GAAP does not report retained earnings/reserves in the same manner as private GAAP. The reserves, called Cumulative Results of Operations, include any change in unrealized losses or gains on the fund’s investment portfolio, its largest asset.
The graph below shows how this “valuation” over-or-understates actual reserves by as much as $466 million (2020). The NCUA does not use this valuation when it calculates the NOL, but it is the amount shown in the NCUSIF’s “net position” in the balance sheet prepared using Federal GAAP.
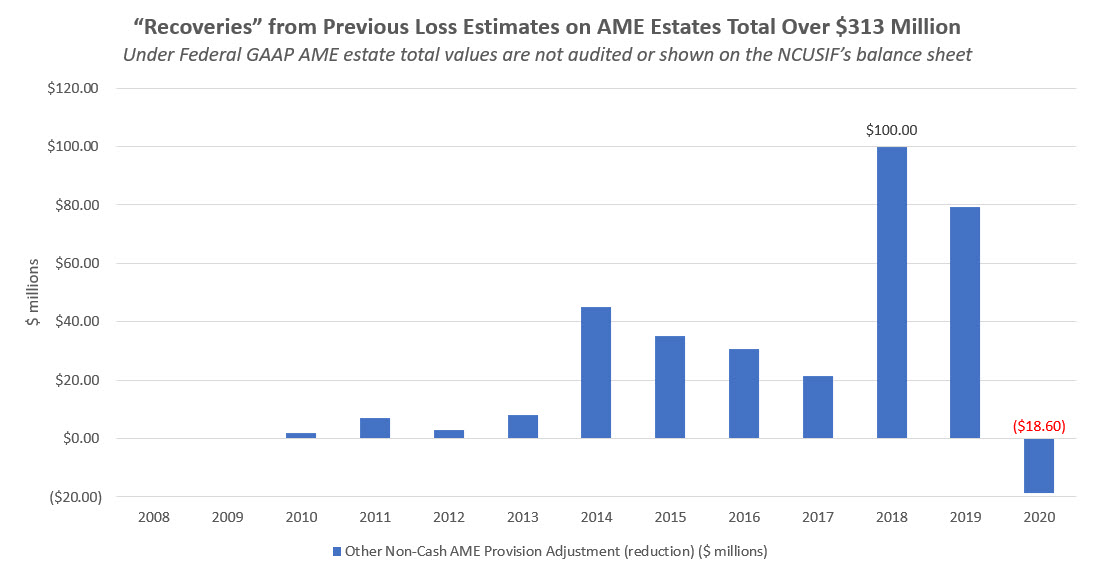
The second point of confusion is adjustments to prior periods of loss estimates for the NCUA’s liquidation estates. As fiduciary assets, these amounts are not included on the “government entity’s” (the NCUA’s) balance sheet. Only the net change in receivables is shown.
The chart below shows these prior adjustments to loss estimates total $313 million and are increasing in amount. These managed assets should be audited, as in private GAAP, and not excluded, so these valuations are subject to independent review.
The resilience of the NCUSIF model
The data shows the NCUSIF financial model is resilient. The combined total of insured losses (1.51) and operating expenses (1.77) are well within the 10 basis point traditional NOL range. This is true even in this 13-year period which includes two major economic crises. This is the actual outcome, not estimates, forecasts, or misleading modeling outputs.
To pay this combined expense of 3.28 basis points requires a 2.5 % investment yield (3.28/130) on the portfolio. If insured losses are 0, then the yield for operating expenses alone is only 1.36%. A portfolio yield range of 1.36% to 2.5%, on average, is sufficient to provide revenue for these two costs.
Incorporating share growth in a dynamic model
If the retained earnings fall below the traditional 1.3% NOL, then the board can assess an annual premium to this cap if needed. Historically, the board has rarely used the premium just to raise the fund’s balance to the maximum 1.3% cap. Rather, it has left the NOL in a range of 1.25 to 1.29 or wherever the financial results ended.
The NCUA’s calculations raising the NOL are suspect
When merging the TCCUSF into the NCSIF in 2017 and again in the December 2020 board meeting, staff recommended keeping the NOL above the historically proven 1.3% cap. The board did not have this authority until CUMAA passed in 1998 which raised the maximum cap to 1.5%.
During the 2008/09 Great Recession and afterward, the board retained the 1.3% cap. The most accurate statement in the 2017 staff presentation for raising this cap was in the concluding slide: “Actual results may vary from projections.” These same models were again used in the December 2020 board NOL update even though wildly inaccurate compared with actual experience.
The 2017 NCUSIF projections were not due to any fundamental change in the NCUSIF’s financial capabilities or the economic outlook. Rather it was an opportunistic effort to retain as much as possible of the TCCUSF surplus upon merger. These funds above 1.3% would then facilitate the liquidations of two taxi medallions in conservatorship without assessing a premium. Board member Rick Metsger and Chairman Mark McWatters confirmed this in public comments.
The NCUA staff continues to use this strained, artificial logic from the TCCUSF merger to keep the NOL above 1.3. Lifting the NOL cap in 2017 was opposed by credit unions unanimously in their comments, but the NCUA changed not a single number in their plan. Credit unions were also clear that the NCUA should go back to the 1.3% cap as soon as possible if the board approved 1.39 as the new NOL cap.
In December 2020, staff recommended a 1.38 NOL cap with the same hoary reasoning. They projected a 16 basis point decline of equity in a moderate recession and another 2 basis points from lower corporate recoveries, adding 18 basis points to the 1.2% lower NOL limit.
As in 2017, these modeled numbers are not based on any verifiable data. Why a lower than expected recovery on corporate AME claims reduces NOL is not explained. Projecting a decline in NOL to justify raising the NOL is circular logic.
The staff’s model includes no recognition that the largest expense to the NCUSIF is the NCUA’s OTR operating costs. Staff did not use this expense factor when justifying the 16 basis points needed to “pre-fund” NCUSF equity for a moderate recession.
The NCUSIF is already funded by the ongoing 1% credit union contributed capital.
Dystopian future forecasts
The NCUA’s models are fictional. Assumptions are not back-tested against real-world results.
Dressed in real numbers, projections are presented as “future facts” (scenarios), which are unknowable. However, these financial myths have immediate consequences for credit unions. The board bases present-day decisions such as OTR expense transfers, premium assessments, capital spending, or dividends on these hypothetical multi-year forecasts. Credit unions then pay the price now for incorrect projections which will only be revealed in the future.
The NCUA’s dystopian forecasting was responsible for the corporate catastrophe. It led to an incorrect understanding of reserves, underestimated future earnings from investments, and ignored the improving current trends in market valuations.
For natural person credit unions, the most dramatic example of mistaken forecasts is the NCUA’s $1.4 billion loss provisions in 2009 and 2010. Actual cash losses for those two years were $373 million. The difference of over $1 billion came out of credit union pockets via premiums.
The year of the worst GDP quarterly fall in American economic history was 2020. Yet the NCUSIF reported positive cash recoveries, not insured losses. This short-lived recession did not impact equity as projected in 2017. Yet staff still asserted the need for a 16 basis points margin even as the 13-year cumulative insured loss experience declined further to 1.5 basis points.
The dominant issue for credit unions when commenting on the NCUA’s NOL request is straightforward. The data shows the challenge is not adding additional resources, but rather managing more effectively and transparently those already in place or on call.