Credit Unions Analyzed
We wanted to find a group of credit unions that use CUSOs extensively and compare their performance to credit unions that do not use CUSOs at all or not as extensively. For the CUSO users, we turned to the credit unions using CU*Answers. CU*Answers, Inc. was formed in 1970 as a core IT provider. It is structured as a cooperative corporation. There are 136 credit union owners serving 183 credit unions.
Xtend, Inc. is an affiliate CUSO that is owned by CU*Answers and 80 credit unions. Xtend provides services to credit unions that include bookkeeping, mortgage loan support, disaster recovery, business continuity, strategic planning, call center (both incoming and outgoing), shared branching, forms exchange, member texting communications, core conversion support, call report preparation, and cooperative liquidity through loan participations and certificate of deposit sales.
AuditLink, a division of CU*Answers, provides shared execution services including vendor management and daily evaluation of high-risk transactional activity. While some credit union owner/customers are over a billion dollars in assets, most customers are small and mid-sized credit unions, the very size that should derive the most benefit from collaboration.
CU*Answers pays dividends to the owners. As a Michigan cooperative, CU*Answers pays a stock dividend each year (averaging between 4% and 8% of the investment for each credit union). There is a patronage dividend which is proportionate to the amount of business a credit union does with the CUSO. If CU*Answers has a special project and needs capital, it will issue debentures which have a return slightly above market. The debentures are often over- subscribed.
The control groups consist of credit unions that are the same asset size as the CU*Answers groups and do not have a CUSO investment. While the available data does not indicate how many CUSOs a credit union may use for services, it is possible to see from the NCUA call reports whether a credit union has a CUSO investment. If a credit union does not have any CUSO investment, the credit union will not have any benefits deriving from CUSO ownership and it is more likely than not that the credit union does not use CUSOs extensively as service providers.
Results
Jay Johnson and Sam Taft at Callahan identified through industry data the credit unions for the control groups that do not have a CUSO investment. Bob Frizzle and Jim Vilker at CU*Answers assisted with the data at their end.
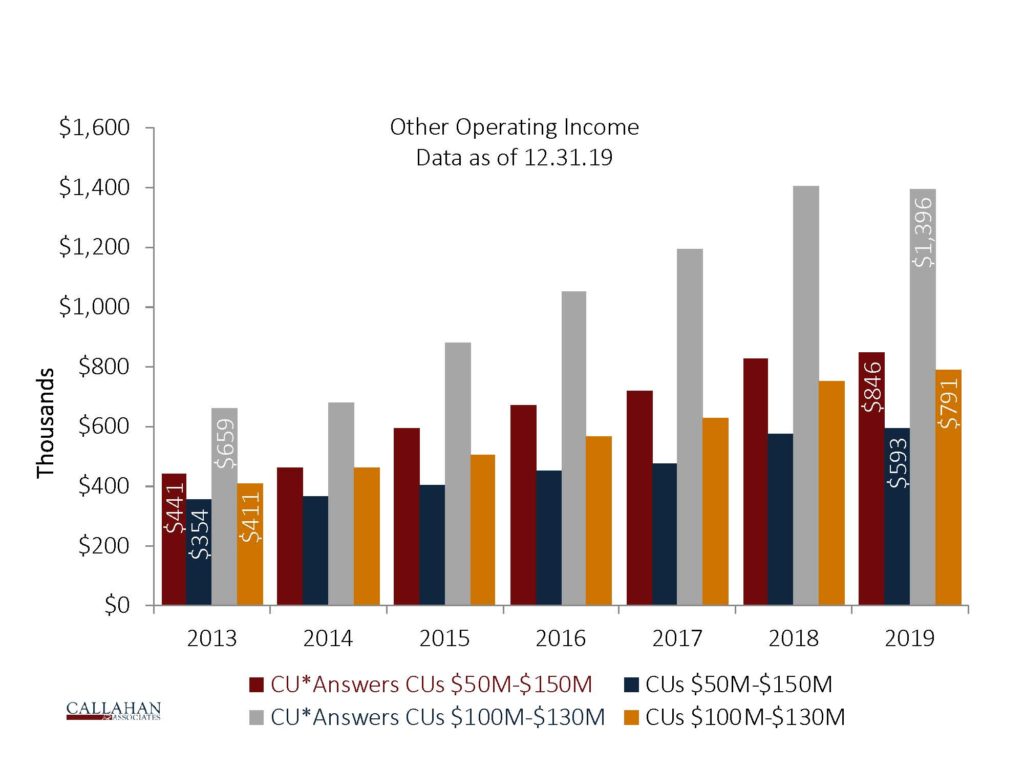
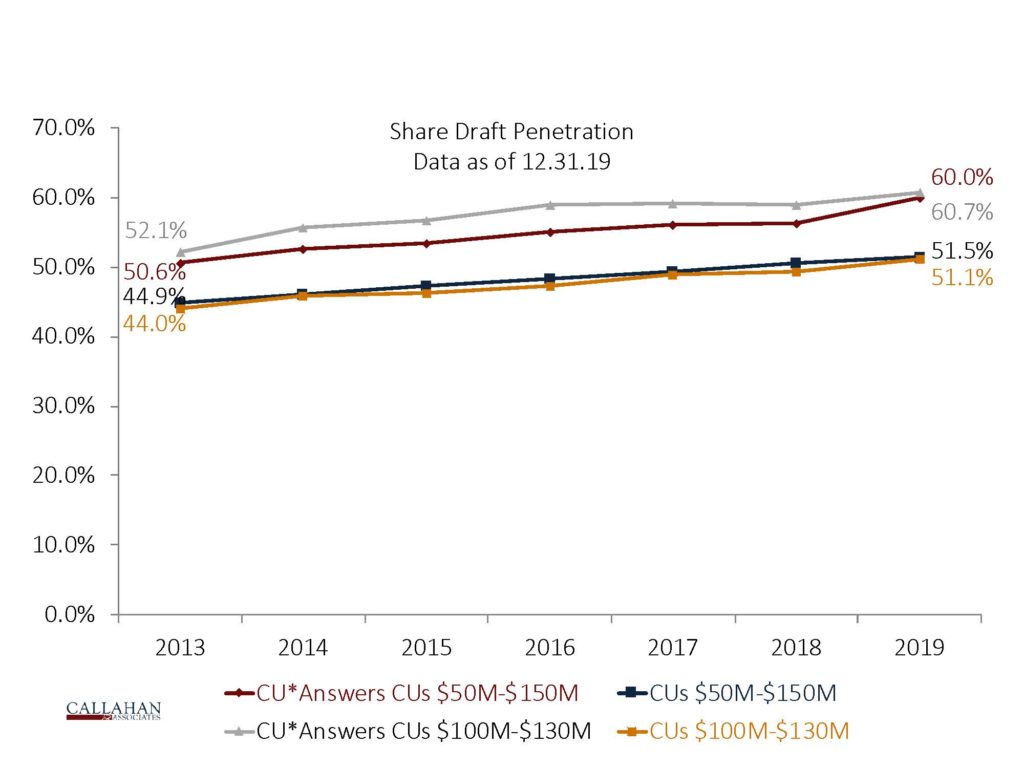
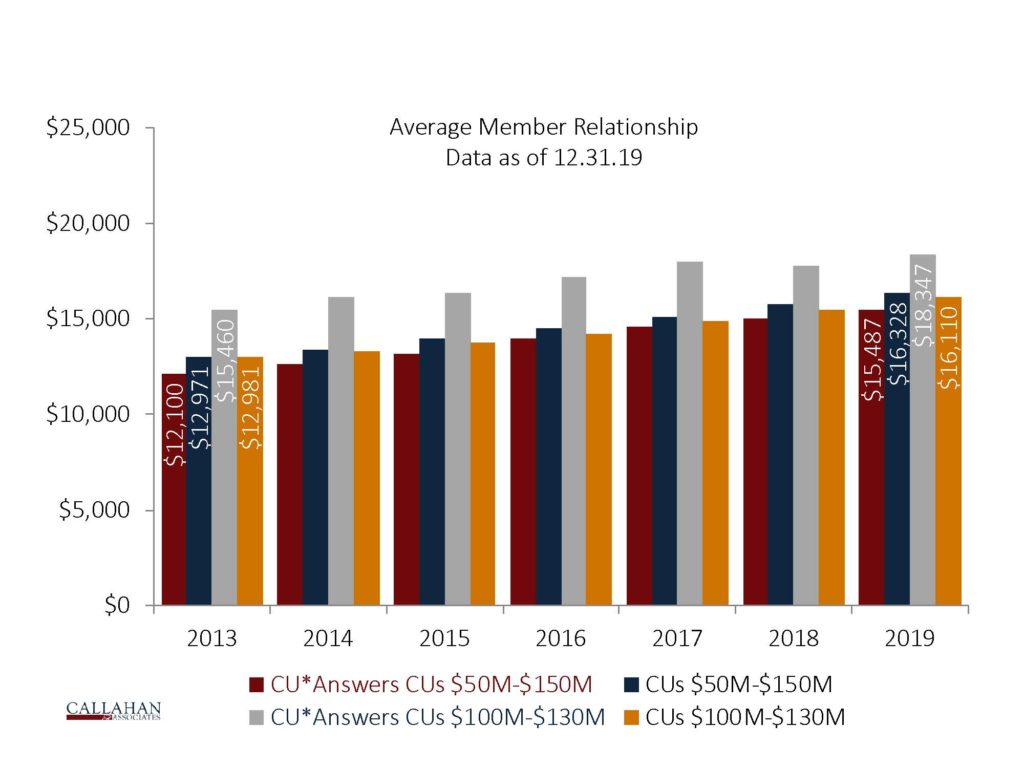
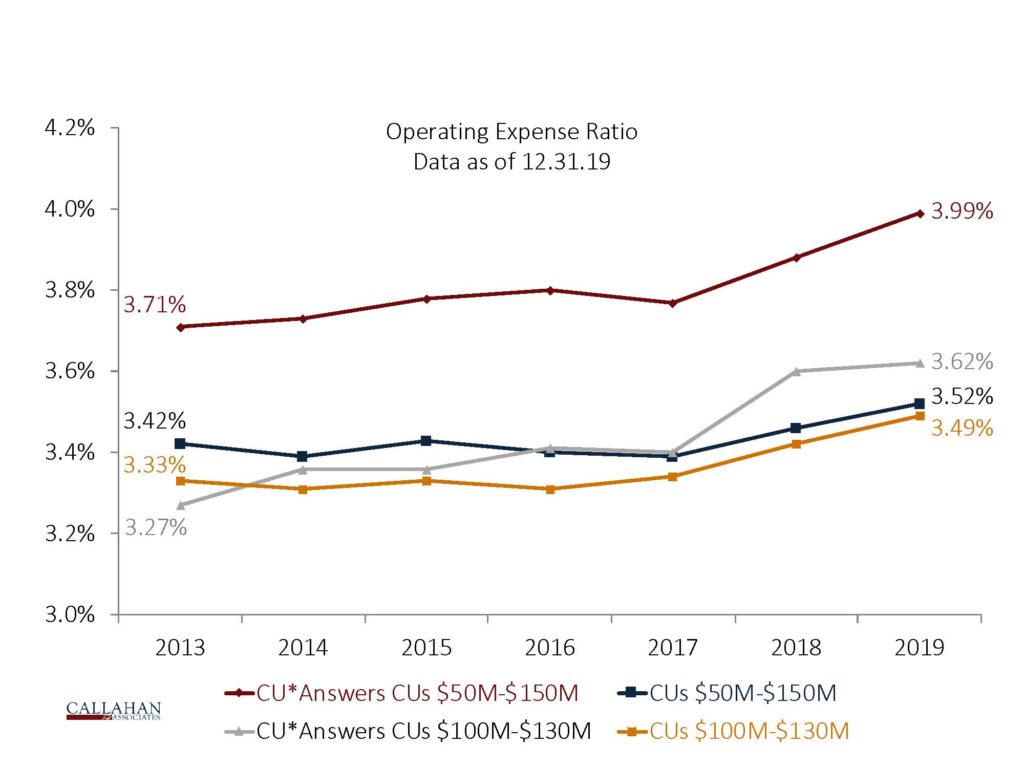
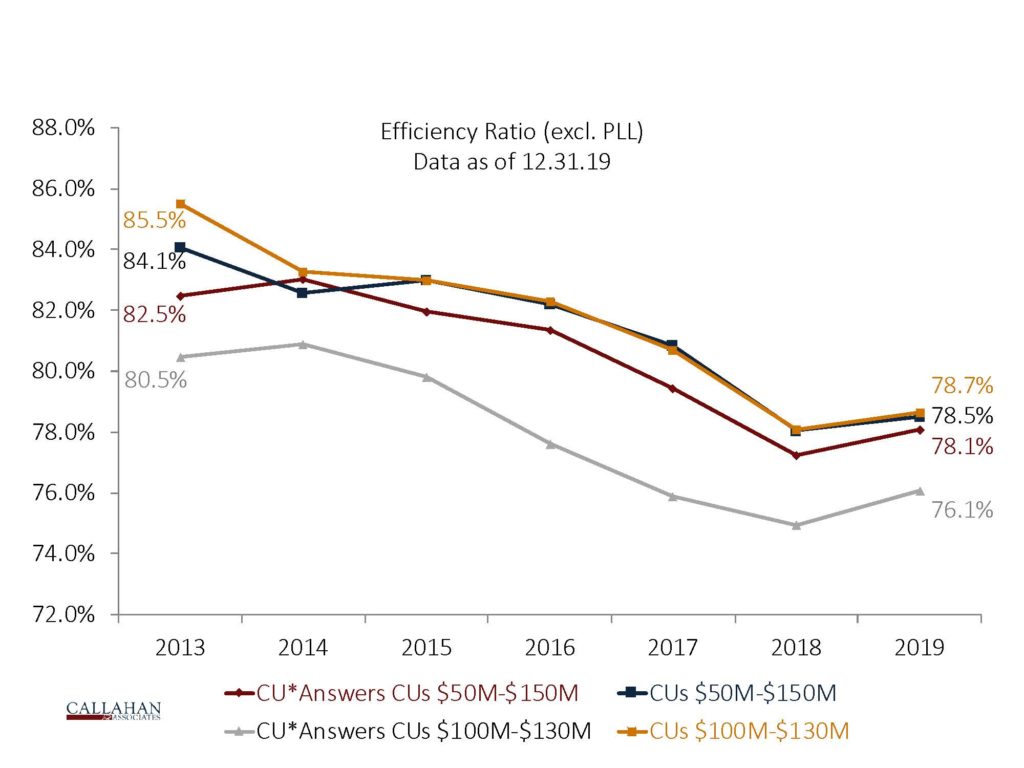
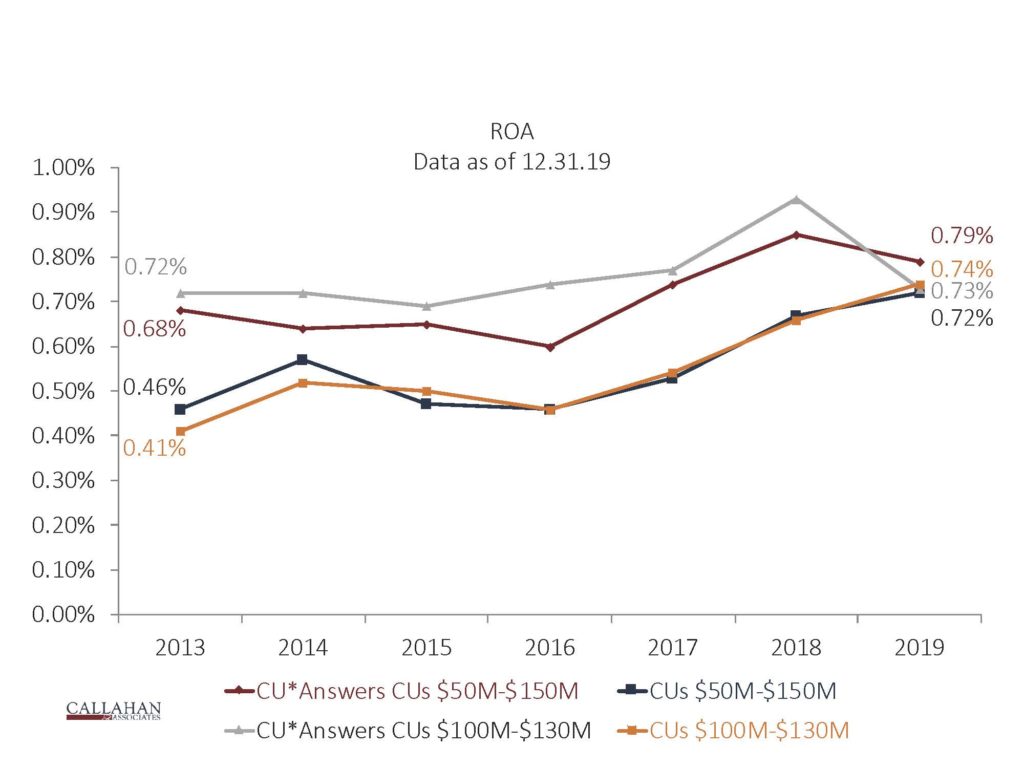
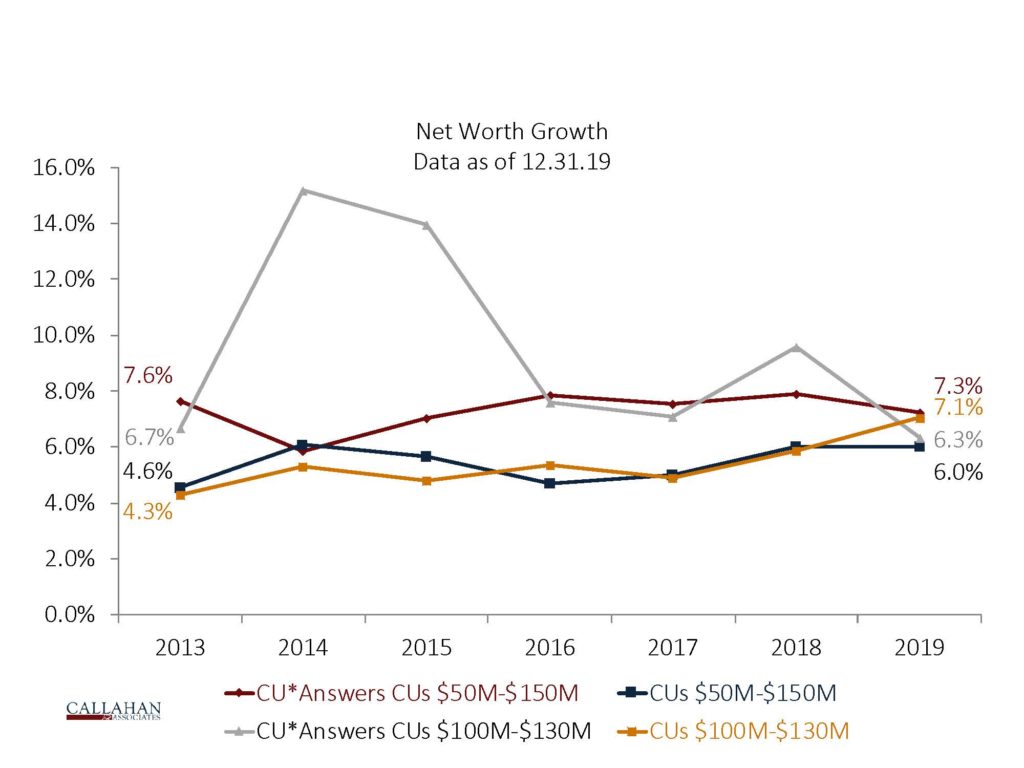
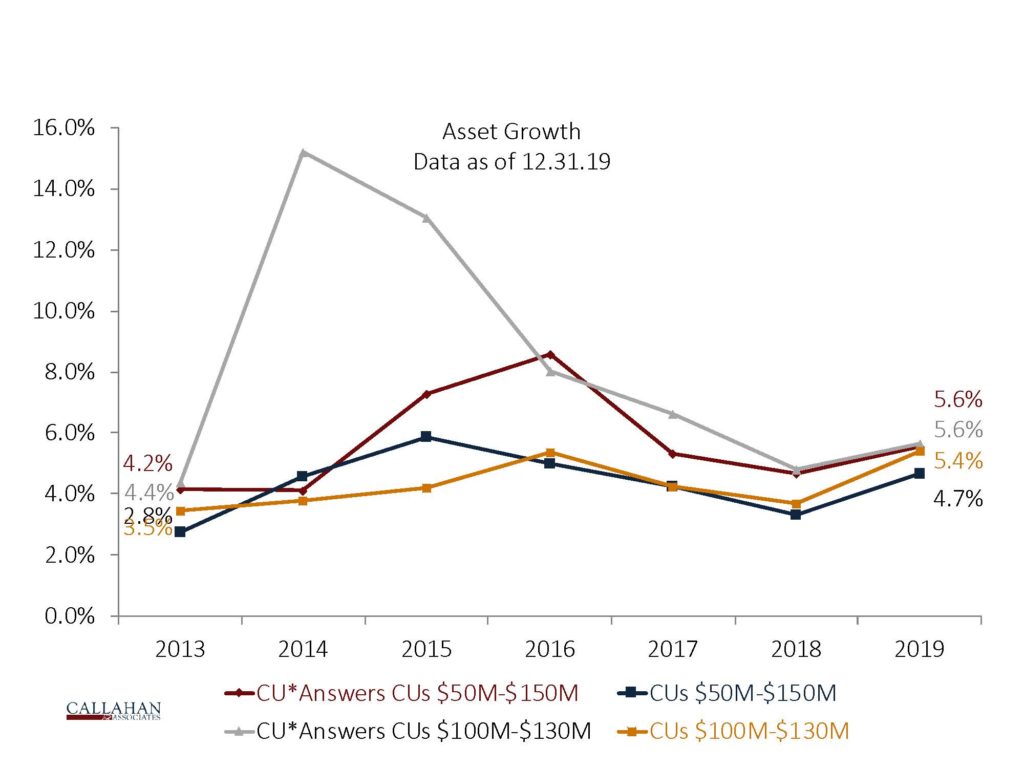
The performance data was measured as of the fourth quarter in years 2013 to 2019 and divided into four cohorts for two peer size comparisons. The first cohort of CU*Answers credit unions between $50 million and $150 million in assets (averaging 52 credit unions per year) measured against the second cohort of credit unions between $50 million and $150 million in assets that do not have a CUSO ownership relationship (averaging 460 credit unions per year). The third cohort of CU*Answers credit unions between $100 million and $130 million in assets (averaging 10 credit unions per year) measured against the fourth cohort of credit unions between $100 million and $130 million in assets that do not have a CUSO ownership relationship (averaging 84 credit unions per year).
Sam Taft at Callahan analyzed the data and prepared the following ten charts which show the performance of the four cohorts for:
- Fee Income
- Other Operating Income
- Share Draft Penetration
- Accounts Per Member
- Average Member Relationship
- Operating Expense Ratio
- Efficiency Ratio (excluding PLL)
- ROA
- Net Worth Growth
- Asset Growth
Fee Income
The Fee Income Chart emphasizes the widening gap between the CU*Answers credit unions and the peer groups. Specifically, over the period, fee income for the CU*Answers credit unions expanded 37.3% for the $50M-$150M range, and 75.4% for the $100M-$130M range – compared to 26.5% and 22.6% for the asset-based peer groups, respectively.


